- Track video engagement, spot drop-offs, and improve courses with AI insights.
- Quick Summary – Course Video Analytics at a Glance
- What's New in Course Video Analytics?
- Why Course Video Analytics Matters to You
- How to Find and Use Course Video Analytics
- Pro Tips for Better Course Video Analytics
- Results You Can Expect from Course Video Analytics
- Frequently Asked Questions About Course Video Analytics
- Make Course Video Analytics Work for You
Track video engagement, spot drop-offs, and improve courses with AI insights.
Course Video Analytics: See How Students Engage
Course Video Analytics in GoHighLevel gives you a clear picture of how students watch your course videos. You can see how long they watch, where they lose interest, and which lessons they finish. Instead of guessing what works, you now have real data to help you improve your courses.
Before this update, it was hard to know how students engaged with each video. Now, Course Video Analytics lets you track watch time, completion rates, and viewer activity in one place. You can also spot where students stop watching or go back to review a section. This helps you find lessons that may need some work.
There’s more to it than just tracking views. With Course AI, you can get useful tips based on how students watch your videos. In this guide, we’ll walk through the new tools, show you how to use them, and explain how they can help you create better courses.

Course Video Analytics helps you see which lessons keep students engaged and where they lose interest. With clear reports and helpful tips from Course AI, you can spot problems, improve your videos, and make better choices about your course content.
Quick Summary – Course Video Analytics at a Glance
Purpose: Course Video Analytics helps you track how students watch and engage with your course videos in GoHighLevel.
Why It Matters: You can see where students lose interest, find lessons that need work, and make better choices using real viewing data.
What You Get: You get video performance reports, watch time, finish rates, retention heatmaps, and optional AI-powered insights through Course AI.
Time to Complete: Allow about 5 to 10 minutes to open the dashboard and review your first video report, once the feature is enabled.
Difficulty Level: Beginner-friendly. You only need basic GoHighLevel navigation skills to get started.
Key Outcome: You’ll know which course videos need attention and have a clear starting point for improving your lessons.
What’s New in Course Video Analytics?
GoHighLevel’s new Course Video Analytics gives you a closer look at how students watch your course videos. The new dashboard tracks views, watch time, engagement, and completion rates. You can also compare results over time to see which lessons are doing well and which ones need more attention.
You can now look at each video in more detail. See how many students watched it, how often they replayed parts, and how many made it to the end. Retention heatmaps show where students stop watching, skip ahead, or go back to review a section. You can also check viewing trends by device and location, view recent stats in the lesson editor, and export reports when needed.
Automate marketing, manage leads, and grow faster with GoHighLevel.
Course AI adds another useful tool. It reviews your video data and suggests ways to improve lessons based on how students watch them. This can help you find weak spots and make better content choices. Just keep in mind that Video Analytics must be enabled in Labs, and AI insights require access to the Course AI Beta.
Why Course Video Analytics Matters to You
Creating a good online course takes time and effort. But how do you know if students are getting value from your lessons? Course Video Analytics helps you see what happens after someone presses play. You can find out which videos hold their attention, which ones they finish, and where they start to lose interest.
This makes it easier to improve your courses without guessing. If students keep leaving a video at the same spot, you can review that section and see what needs to change. If they replay a part several times, it may mean the topic is useful or needs a clearer explanation. With Course AI, you can also get suggestions based on these viewing patterns.
For agencies, coaches, and course creators, this means better insight into how people learn. You can use the data to improve client training, staff onboarding, or paid courses. Instead of spending time fixing lessons that already work, you can focus on the ones that need the most help.
How to Find and Use Course Video Analytics
Course Video Analytics gives you a simple way to see how students watch your course videos in GoHighLevel. You can track video views, watch time, engagement, and finish rates. This helps you find which lessons are doing well and which ones may need some work.
Here are the steps we will follow:
- Open the Course Analytics area.
- Find and review the Video Analytics.
To start, make sure you are logged in to the correct GoHighLevel sub-account and have access to Course Video Analytics.
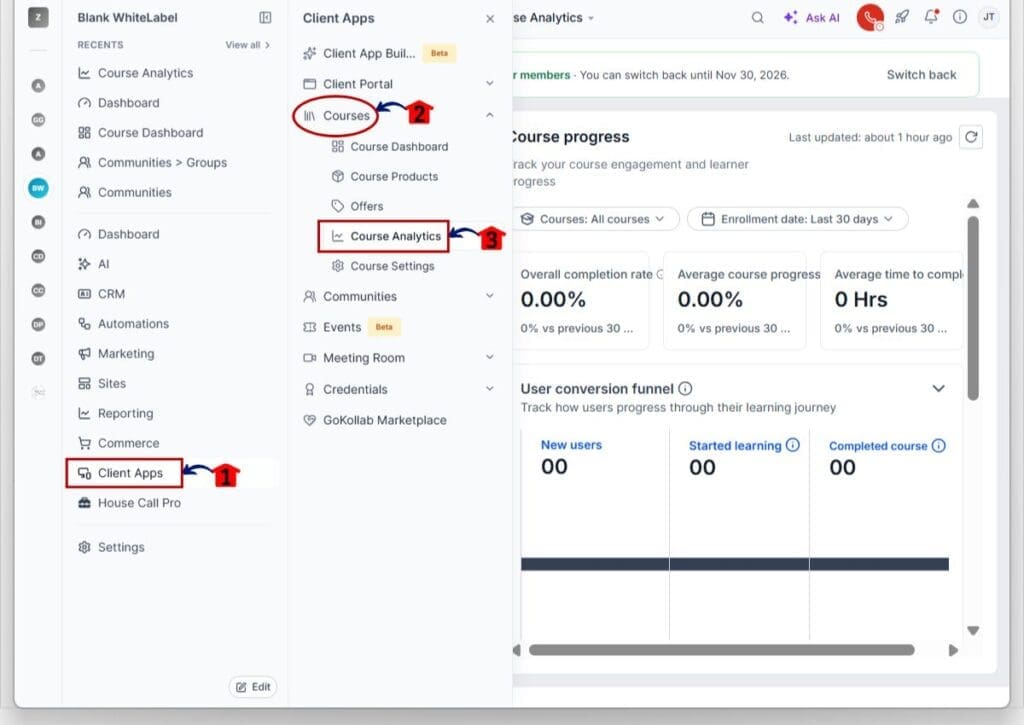
Step 01 – Open the Course Analytics Area
- Course Analytics is found inside the Client Apps section of your GoHighLevel sub-account.
1.1 Click Client Apps from the main left-hand menu.
- This opens the Client Apps menu, where you can access the tools used to manage your courses and client portal.
1.2 Click Courses from the Client Apps menu.
- This expands the Courses menu and shows the available course tools.
1.3 Click Course Analytics.
- This opens the Course Analytics dashboard, where you can review course progress, student activity, and video performance.
Step 02 – Find and Review Video Analytics
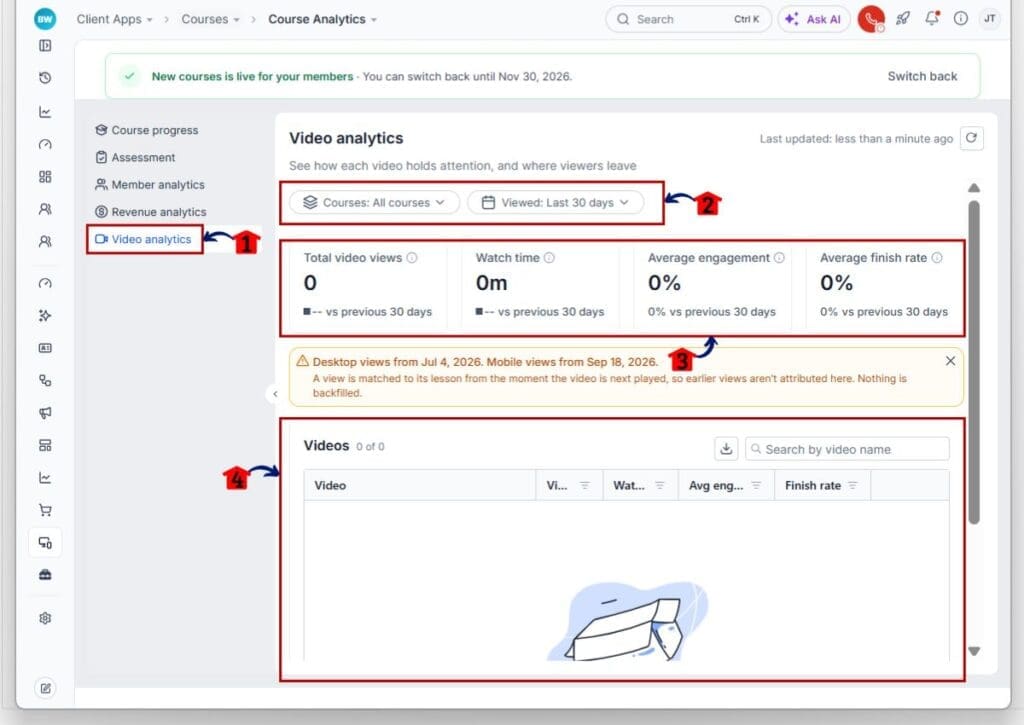
- The Course Analytics dashboard has a separate Video Analytics area where you can view how students engage with your course videos.
2.1 Click Video analytics from the left-hand menu.
- This opens the Video Analytics dashboard, where you can review video performance across your courses.
2.2 Use the Courses and Viewed filters at the top of the dashboard.
- The Courses filter lets you view all courses or focus on a specific course.
- The Viewed filter lets you select the reporting period. In this example, it is set to the last 30 days.
2.3 Review the video performance metrics.
- Total video views show how many times your course videos were viewed.
- Watch time shows the total time students spent watching.
- Average engagement helps you see how much of your videos students watch.
- Average finish rate shows how often viewers reach the end of a video.
- You can also compare these results with the previous 30 days.
2.4 Review the Videos section below the main metrics.
- This area lists your course videos and their performance data.
- Use the search bar to find a video by name.
- Review the views, watch time, average engagement, and finish rate for each video.
- Click the export icon to download video performance data for further review.
Course Video Analytics gives you a clearer view of how students engage with your lessons. Start with the main dashboard to see overall performance, then review individual videos to find areas that may need improvement. You can use this information to make small changes and track how students respond over time.
Pro Tips for Better Course Video Analytics
Getting the most from Course Video Analytics starts with knowing what to look for. Don’t focus on views alone. A video may get plenty of views, but that doesn’t mean students watch it to the end. Check the average engagement and finish rates to see which lessons hold their attention. This gives you a better idea of what works and what needs attention.
Pay close attention to where students stop watching or replay parts of a video. A sudden drop in views may mean a section is too long or hard to follow. If students keep watching the same part, they may find it useful or need more help with the topic. Review these sections before making changes, and use Course AI suggestions when available.
Make it a habit to check your reports every few weeks. Compare videos from the same course and look for changes in watch time and finish rates. Start by fixing one lesson at a time, then check the results again. Small changes, such as shorter videos or clearer steps, can make your course easier to follow.
Results You Can Expect from Course Video Analytics
Course Video Analytics helps you make better choices about your video lessons. Instead of guessing why students stop watching, you can use real data to find areas that need work. This makes it easier to improve your content and focus on lessons that may not be holding students’ attention.
For example, an agency may notice that students often leave a client training video halfway through. By checking the retention data, the team can find where viewers lose interest. They might shorten the lesson, break it into smaller parts, or explain a tricky step more clearly. These simple changes can make the training easier to follow.
Over time, you can compare watch time, engagement, and finish rates to see if your changes are helping. You may also spend less time reviewing videos that already perform well. While better results aren’t guaranteed, the data gives you a clear starting point to improve your courses.
Frequently Asked Questions About Course Video Analytics
Make Course Video Analytics Work for You
Course Video Analytics gives you a better way to see how students engage with your lessons. With clear reports, retention heatmaps, and helpful Course AI insights, you can find weak spots and make changes that improve your course content.
Start by reviewing your video reports in GoHighLevel. Pick one lesson that needs attention, make a few changes, and track the results. It’s a simple way to build better courses using real data.
Have you tried Course Video Analytics yet? What have you learned about how students watch your videos?
Scale Your Business Today.
Streamline your workflow with GoHighLevel’s powerful tools.