GoHighLevel’s new Traffic Source Analytics dashboard helps you track paid vs. organic performance, identify trends, and make smarter marketing decisions.
If you’ve ever wondered exactly where your leads are coming from, GoHighLevel just made your life a whole lot easier. The new Traffic Source Analytics dashboard gives you instant visibility into every major channel—Paid, Organic, Direct, Referral, and Other—all in one place. For agencies and marketers juggling multiple campaigns, this update isn’t just another chart.
It’s your new control center for spotting what’s working, what’s not, and where your next big opportunity lies. Instead of digging through Google Analytics or spreadsheets, you can now track trends, compare traffic types, and drill down into specific days or campaigns—all right inside GHL This means no more guessing, no more manual reports, and no more second-guessing your ad spend. With Traffic Source Analytics, every click, visit, and channel gets the clarity it deserves.
With GoHighLevel’s new Traffic Source Analytics dashboard, you can instantly see which channels drive results, compare Paid vs. Organic traffic, and make faster, data-backed decisions that improve ROI and campaign performance.
Quick Summary – Traffic Source Analytics at a Glance
Purpose:
The new Traffic Source Analytics dashboard helps GoHighLevel users quickly see where their website visitors come from, compare Paid vs. Organic traffic, and track trends over time — all within one clean, visual report.
Why It Matters:
It provides instant visibility into what’s driving your growth, so you can make smarter, faster marketing decisions without juggling multiple analytics tools.
What You Get:
A full channel breakdown (Organic, Paid, Direct, Referral, Other), hover tooltips for detailed visitor counts, daily drilldowns, and color-coded visuals that make data analysis easy and accessible.
Time to Complete:
You can access and use Traffic Source Analytics in minutes — it’s already built into your GHL Analytics dashboard.
Difficulty Level:
Beginner-friendly. No setup, coding, or third-party integration required.
Key Outcome:
You’ll gain clear, actionable insights into your top-performing marketing channels, eliminate guesswork in ad spend, and align your team around real, data-driven results.
What’s New in Traffic Source Analytics
The Traffic Source Analytics feature inside GoHighLevel is built to simplify how agencies visualize website performance. It’s a clean, interactive dashboard that helps you see exactly where your visitors are coming from — no setup, no extra integrations, just instant insights.
Automate marketing, manage leads, and grow faster with GoHighLevel.
When you open the dashboard, you’ll notice a Channel Breakdown displayed as stacked bar charts. Each bar represents your daily traffic volume, segmented by source: Organic Search, Paid Search, Direct, Referral, and Other. This makes it easy to see which channels are driving consistent growth and which ones need attention.
Hover over any part of the chart and you’ll see exact visitor counts — for example, “Paid Search: 233,390 on Jan 27.” This level of detail helps agencies report results with confidence and catch trends that might otherwise go unnoticed.
You can even click on any day to drill down into a specific date. This instantly filters the entire dashboard, allowing you to investigate what happened on a particular day — maybe a campaign launch, a new blog post, or a sudden spike from paid ads.
To make scanning faster, GoHighLevel uses a consistent color system across all channels. Each traffic type has its own distinct color, designed for accessibility and speed. That means at a glance, you can tell how each source contributes to your overall traffic picture without squinting at the screen or guessing.
The result? Traffic Source Analytics turns your raw data into visual clarity — helping agencies, marketers, and business owners see performance trends without ever leaving the GHL platform.
Why Traffic Source Analytics Matters
Data is only powerful when it tells a clear story — and that’s exactly what Traffic Source Analytics does for every GHL user. It bridges the gap between your marketing channels and your actual business outcomes, giving you visibility that used to take hours (and several tools) to piece together.
When you can instantly see which traffic sources are performing best — whether it’s Organic Search, Paid Ads, or Direct — you can make smarter, faster decisions about where to invest your marketing dollars. No more guesswork, no more “gut feeling” meetings. Just data-backed clarity.
For agencies, this means stronger client retention. You can show clients exactly where their leads originate, prove the ROI of campaigns, and back every report with clean, easy-to-read visuals. It’s transparency at scale — and it positions your agency as the trusted expert that doesn’t just deliver leads, but shows how they’re generated.
For business owners, Traffic Source Analytics helps identify trends that affect growth:
- Attribution accuracy – understand what’s really driving conversions
- Budget optimization – shift spend to channels producing real results
- Trend tracking – spot seasonal dips or traffic spikes early
In short, this feature turns marketing analytics from a guessing game into a growth engine. By aligning teams around shared data, Traffic Source Analytics helps everyone — from strategists to CEOs — make decisions based on performance, not opinions.
How to Use Traffic Source Analytics (Step-by-Step)
Getting started with Traffic Source Analytics inside GoHighLevel only takes a few clicks. Here’s how to navigate it like a pro and start pulling real insights from your traffic data.
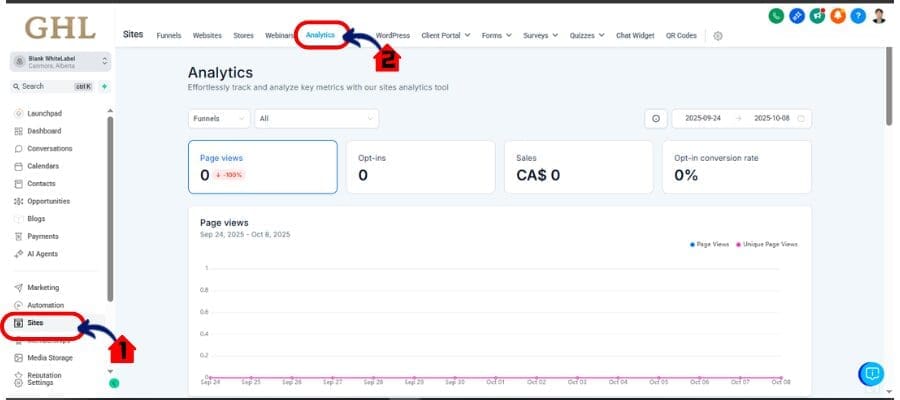
Step 01 – Access the Main Left Hand Menu in GoHighLevel
The Main Menu on the Left side of your screen has all the main areas that you work in when using GHL
1.1 Click on the Sites Menu Item.
- Access the ‘Site’ section of GoHighLevel
- You’ll now be in the ‘Sites’ section of GHL, where you can access the Analytics section from the top menu:
1.2 Click on the ‘Analytics’ menu link.
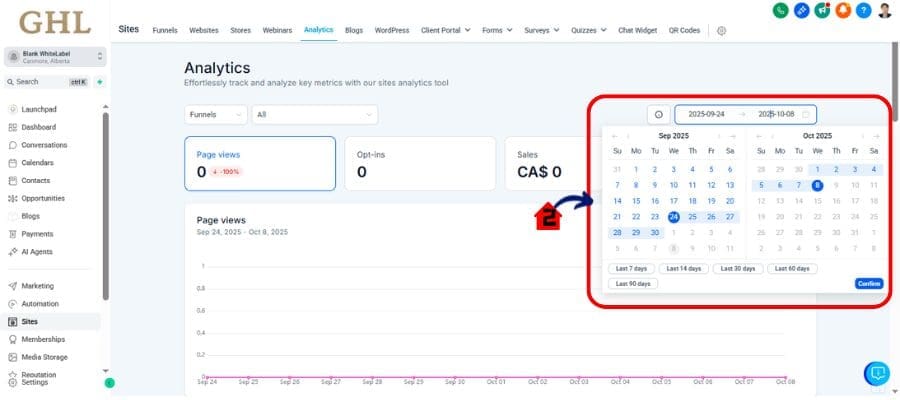
Step 02 – Choose Your Date Range
- At the top of the screen, set the period you want to analyze. You can compare daily, weekly, or monthly trends. This is perfect for identifying growth patterns or measuring campaign results over time.
2.1 Choose Date Range
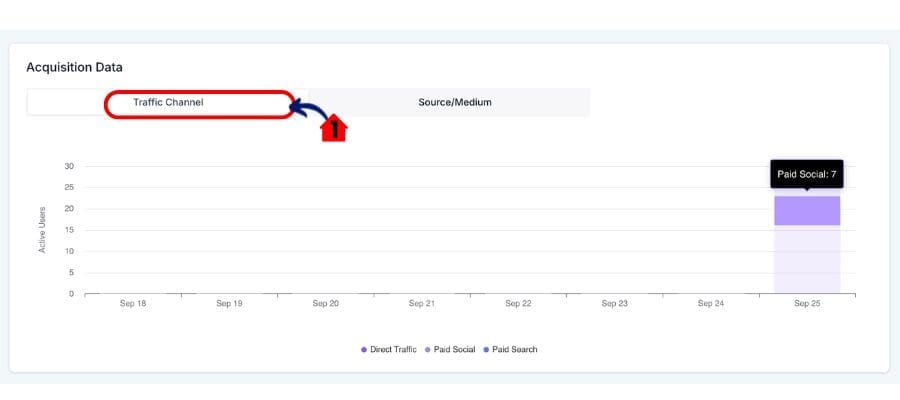
Step 03 – Hover Over Any Bar for Channel Counts
- Move your cursor over the stacked bar chart to reveal hover tooltips showing the exact visitor count for each source. For example: “Organic Search: 12,875 visits.” This makes it easy to see daily performance at a glance without diving into spreadsheets.
- Need to analyze a specific day? Click on that bar to instantly filter your view. The dashboard will zoom into that day, showing only that date’s traffic source breakdown — ideal for post-campaign checks or investigating a sudden spike.
3.1 Check Channels
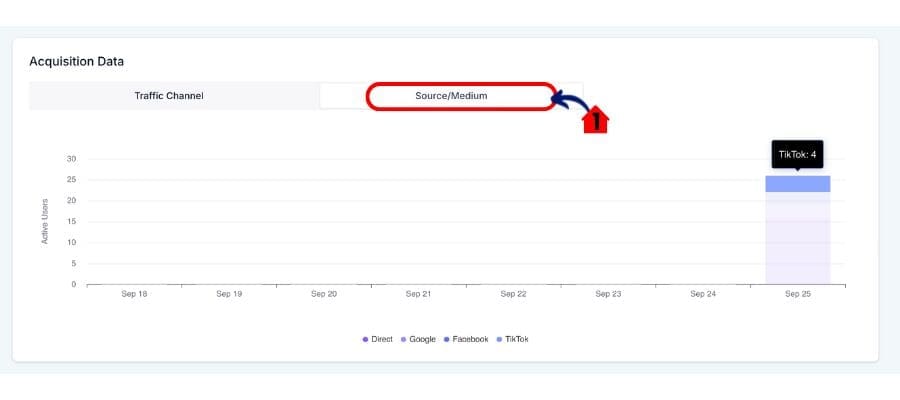
Step 4: Use Channel Filters for Focused Analysis
- On the side menu, you can toggle individual channels on or off. For instance, if you want to compare Paid Search vs. Organic Search, just deselect the others. This helps you isolate what’s working best across campaigns.
- You can screenshot or export your analytics summary for internal reporting or client presentations. Use these visuals to back up campaign performance, optimize future ad spend, and show results with confidence.
4.1 Filter Channel
With these steps, you’ll quickly turn raw visitor data into actionable insights — all thanks to Traffic Source Analytics, built right into the GHL platform.
Pro Tips for Agencies Using Traffic Source Analytics
Once you’ve mastered the basics, it’s time to use Traffic Source Analytics like a strategist. These insider tips will help agencies and marketers squeeze every drop of value out of this powerful dashboard.
1. Compare Paid vs. Organic Trends Over Time
Use longer date ranges — 30, 60, or 90 days — to uncover how your paid campaigns perform next to organic growth. This gives you visibility into the real ROI of your marketing mix and helps you plan ad spend more efficiently.
2. Track Seasonality and Campaign Cycles
Toggle your date filters around major launches or promotions. Look for spikes in specific channels and note whether they’re consistent year over year. Identifying patterns like this helps you forecast future performance with precision.
3. Use Channel Filters to Spot Weak Links
If a channel’s performance starts dipping, isolate it and investigate. Maybe a referral source changed, or your ad traffic isn’t converting. Traffic Source Analytics helps you detect issues early before they become major revenue leaks.
4. Create a Recurring Reporting Routine
Set a recurring schedule (weekly or monthly) to review analytics. Use screenshots or exported visuals from GHL to update your clients or internal team. Regular reviews build trust and ensure continuous optimization.
5. Pair Traffic Data with CRM Insights
Combine your Traffic Source Analytics findings with data from your CRM pipeline. When you can connect traffic trends directly to conversions and deals won, your agency instantly moves from “marketing provider” to “strategic growth partner.”
6. Standardize Channel Colors Across Reports
Stick to GHL’s built-in consistent color system when creating external visuals or presentations. This keeps your reports accessible, clear, and easy for clients to understand at a glance.
By using these pro techniques, you’re not just tracking where traffic comes from — you’re building a smarter, leaner marketing strategy that turns insights into predictable growth.
What This Means for Your Business
The real power of Traffic Source Analytics isn’t just in tracking numbers — it’s in transforming how your business makes marketing decisions. For agencies and small business owners alike, this new dashboard turns complex data into clear direction.
With instant visibility into every major traffic channel, you can now answer the questions that matter most:
- Where are our best leads coming from?
- Which campaigns actually move the needle?
- How should we adjust our ad spend this month?
By centralizing this data inside GoHighLevel, Traffic Source Analytics eliminates the need for multiple tools and manual exports. That means less time juggling spreadsheets and more time acting on insights that grow your bottom line.
For agency owners, it also creates alignment across teams. Marketing, sales, and leadership can now view the same transparent data — no conflicting reports, no “he said, she said” over attribution. Everyone’s looking at one source of truth.
The result? Faster decisions, smarter budgeting, and stronger client relationships. When you can prove where results come from, you don’t just run campaigns — you run the business with confidence.
In short, Traffic Source Analytics gives you control, clarity, and confidence — three things every growing agency or business needs to scale successfully.
Results You Can Expect from Traffic Source Analytics
Once you start using Traffic Source Analytics, you’ll quickly notice how much easier it is to connect marketing activity with real business results. It’s not just about prettier charts — it’s about transforming data into decisions.
Here’s what you can expect after using it consistently:
1. Clear Attribution for Every Campaign
No more arguing over where leads came from. You’ll know exactly which traffic sources deliver the highest-quality visitors — whether that’s Google Ads, SEO, social, or referrals.
2. Smarter Ad Spend and Budget Control
Seeing the performance of Paid vs. Organic channels side by side gives you the power to reallocate funds to what’s actually working. Cut waste, double down on what converts, and watch ROI climb.
3. Faster Trend Detection
Instead of finding out about performance drops weeks later, you’ll catch them in real time. Daily stacked bar views make it easy to see patterns, spikes, or declines before they impact your bottom line.
4. Improved Client Transparency
For agencies, reporting becomes effortless. Use the visual dashboards in Traffic Source Analytics to show clients their performance story — clearly, confidently, and without the clutter of third-party tools.
5. Predictable Growth and Planning
When you can connect traffic volume to conversion performance, forecasting becomes easier. You’ll know what to expect next month — and which channels are ready to scale.
Ultimately, Traffic Source Analytics replaces guesswork with grounded insights. You’re not just tracking traffic — you’re shaping the strategy behind it.
FAQs About Traffic Source Analytics
1. Where do I find Traffic Source Analytics inside GoHighLevel?
You can access it from your main dashboard by navigating to Analytics → Traffic Source Analytics. It’s part of GHL’s built-in analytics suite — no setup or integrations required.
2. What traffic sources does it track?
The Traffic Source Analytics dashboard automatically breaks down your visitor data into five main categories:
- Organic Search
- Paid Search
- Direct
- Referral
- Other
Each is color-coded for fast recognition and easy reporting.
3. Can I drill down into specific dates or campaigns?
Yes. You can click any day on the stacked bar chart to filter the dashboard view for that date. This helps you see what influenced spikes or dips in traffic — such as a campaign launch, ad push, or new blog post.
4. Does Traffic Source Analytics track conversions too?
Currently, it focuses on visitor-level traffic insights (not conversions). However, when you connect this data with your CRM and pipeline analytics, you can easily trace which channels drive the most leads and sales.
5. Can I share these reports with clients?
Absolutely. You can screenshot, export, or include visuals in your client reports. Many agencies use Traffic Source Analytics as part of their monthly reporting templates to highlight growth and justify marketing spend.
6. How often does the data update?
Data refreshes daily, giving you a near real-time view of your website performance. This means you can act quickly when you see patterns shift.
7. Does this replace Google Analytics?
Not necessarily — but it makes your daily and client-facing reporting far simpler. Think of Traffic Source Analytics as your at-a-glance performance dashboard, while deeper analysis (like behavior or session data) can still be done through Google Analytics if needed.
Conclusion
GoHighLevel’s Traffic Source Analytics isn’t just another reporting tool — it’s your new marketing command center. It gives you the visibility to see what’s working, the clarity to make smarter moves, and the simplicity to keep your analytics clean and client-ready.
Instead of juggling tools, exporting spreadsheets, or guessing where leads come from, you can now open one dashboard and instantly see the story behind your traffic. You’ll know which campaigns are driving growth, where to trim wasted spend, and how to scale the channels that matter most.
For agencies, this is a massive time-saver. It elevates your client reporting and strengthens trust by showing transparent, data-driven results. For business owners, it means finally understanding how your marketing dollars are performing — without hiring an analyst to decode it.
At the end of the day, Traffic Source Analytics helps you move from reacting to leading. You’re not chasing data anymore — you’re using it to create momentum.
So go ahead: head into Analytics → Traffic Source Analytics inside your GHL dashboard, explore your channel mix, and start turning data into action today.
Scale Your Business Today.
Streamline your workflow with GoHighLevel’s powerful tools.
