- Get detailed traffic insights by location inside your GHL dashboard
- Quick Summary – Geographic Analytics Overview
- What’s New: State and City-Level Traffic Insights
- What Changed: From Country-Only to Local Drilldowns
- Why It Matters: Targeting, Budgeting, and Strategy
- How to Use the Geographic Analytics Update
- Pro Tips for GHL Agencies
- What This Means for Your Agency
- Results You Can Expect
- FAQs about this Geographic Analytics Update
- Final Take: Why Every GHL User Should Use This
Get detailed traffic insights by location inside your GHL dashboard
Geographic analytics in GHL now makes it possible to view where your traffic is coming from at the state and city level. This update gives GoHighLevel users more accurate location data, right inside the analytics dashboard.
Before this, you could only see broad traffic stats by country. For most local businesses and agencies, that was never detailed enough to guide decisions. Now, the platform lets users drill down deeper to see exactly which regions are bringing in visitors.
This matters because traffic insights by city or state help marketers adjust campaigns to fit real demand. Instead of spreading budgets too wide, they can now focus on areas that perform better.
This change turns a basic overview into something useful for targeting and lead strategy.
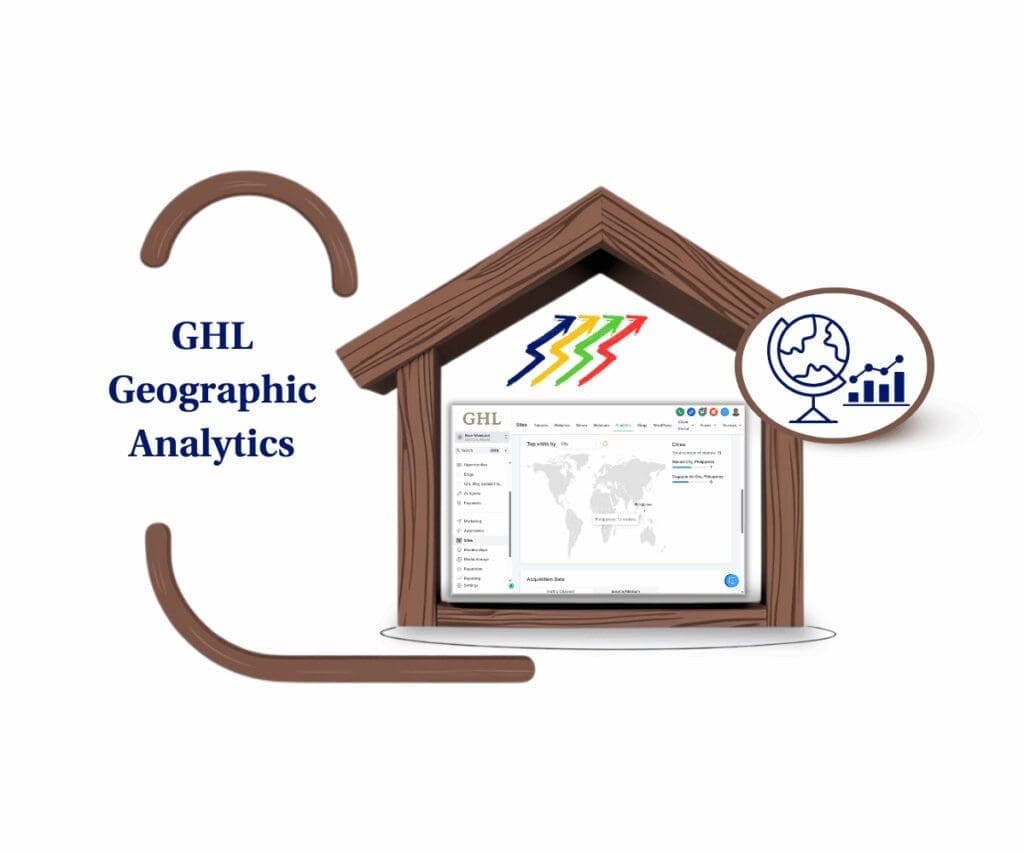
With GHL’s new geographic analytics, users can finally see where their traffic really comes from at a local level. This helps agencies and business owners create better campaigns, track performance more clearly, and stop guessing when it comes to targeting.
Quick Summary – Geographic Analytics Overview
Purpose: This feature helps users understand where their traffic is coming from by showing data at the state and city level inside GHL.
Why It Matters: Agencies and businesses can use this data to focus their time and budget on the places that bring real results.
What You Get: A new view in the analytics dashboard with a dropdown to switch between country, state, and city. It also includes a map, traffic counts, and a list of top locations.
Time To Complete: Takes just a few minutes to explore and apply what you learn.
Difficulty Level: Simple. Anyone familiar with the GHL dashboard can use it right away.
Key Outcome: Users get better insight into traffic patterns, which leads to smarter marketing and stronger local performance.
What’s New: State and City-Level Traffic Insights
The latest update to GHL adds more depth to the platform’s geographic analytics. Users can now view traffic data not just by country, but also by individual states and cities. This brings more clarity to where visitors are coming from and helps agencies better understand local engagement.
Instead of looking at broad traffic numbers, users can now zoom in and get specific.
Automate marketing, manage leads, and grow faster with GoHighLevel.
Here’s what was added:
- Dropdown control to switch between Country, State, and City views in one click.
- Interactive heatmap that highlights traffic-heavy areas with darker shades.
- Hover tooltips that show exact visitor counts when pointing to a location.
- Real-time refresh that updates both the map and list based on selected region level.
- Ranked list of top locations next to the map for quick insight into high-performing areas.
- Auto-updating visitor totals that change based on the region being viewed.
This update makes it easier for agencies and businesses to work with geographic analytics inside GHL. It removes the need for outside tools and gives quick access to the kind of data that supports smarter local strategies.
What Changed: From Country-Only to Local Drilldowns
Before this update, GHL’s geographic analytics only showed traffic by country. That worked fine for getting a general sense of where visitors were coming from, but it didn’t help much when decisions had to be made at the local level.
Now, users can drill down into state and city data right inside the platform. This makes it easier to see which areas are getting the most traffic and how that lines up with their marketing efforts.
Here’s how the experience has improved:
- The old version only offered country-level traffic data.
- The new version includes full access to state and city-level views.
- Users used to rely on outside tools or rough estimates.
- Now, they can get more accurate data directly inside the GHL dashboard.
This shift gives agencies and business owners more control over how they measure local engagement. With more useful location data available, they can make better choices about where to focus campaigns.
Why It Matters: Targeting, Budgeting, and Strategy
Geographic analytics in GHL now gives users more than just a map. It gives them a way to make better choices.
When traffic data is limited to the country level, it can hide what is really happening in local markets. With state and city-level insights, users can start seeing where their efforts are paying off and where they are not.
Here is why that matters:
- Campaigns can target smarter by focusing on locations that bring in more traffic.
- Ad budgets can stretch further by cutting spend in underperforming areas.
- Marketing strategy can adjust based on how different regions respond.
Instead of using the same message everywhere, users can now shape content, ads, and follow-ups to fit what works best in each location. That means better results and fewer missed opportunities.
For agencies and local businesses, having this kind of location data makes it easier to guide clients, spot growth trends, and improve how campaigns are built.
How to Use the Geographic Analytics Update
Geographic analytics in GHL is built right into the dashboard, so it does not take much to get started. Anyone who has access to the analytics tab can use it without setting anything up.
Here is how to use the new feature:
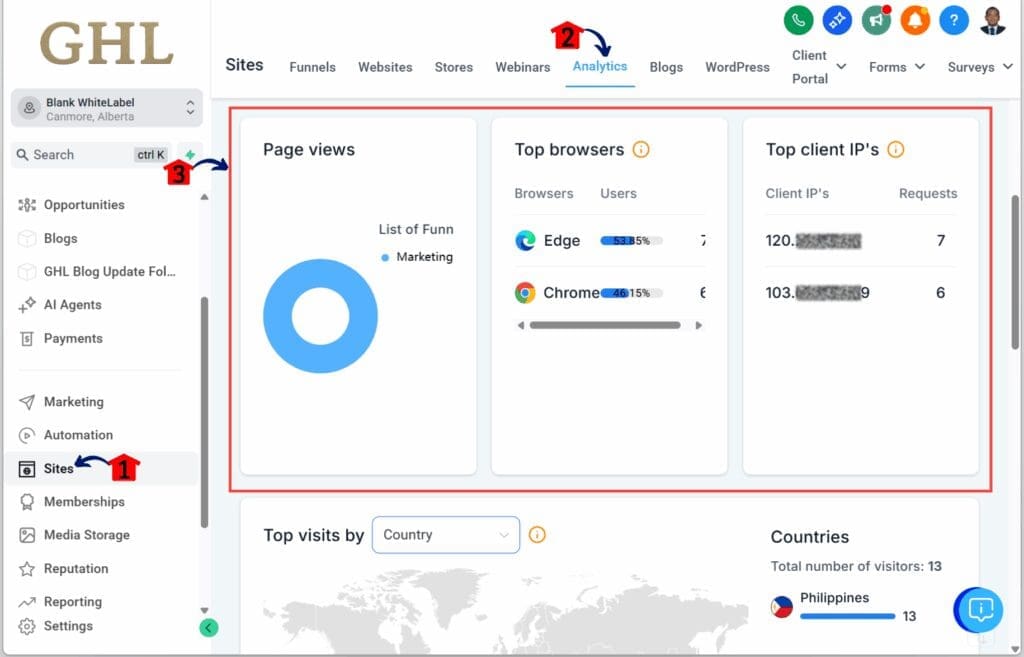
Step 01 – Access the Main Menu in GoHighLevel
- The main menu on the left side of your screen includes all the main areas you work in when using GoHighLevel (GHL).
1.1 Click on the Sites menu item to access the Analytics section.
- You’ll now be in the Sites section, where you can access the Analytics tab from the top menu.
1.2 Click the Analytics tab.
1.3 Check the Page Views / Top Browsers / Top Client IPs section.
- Scroll down within the Analytics tab to view this section.
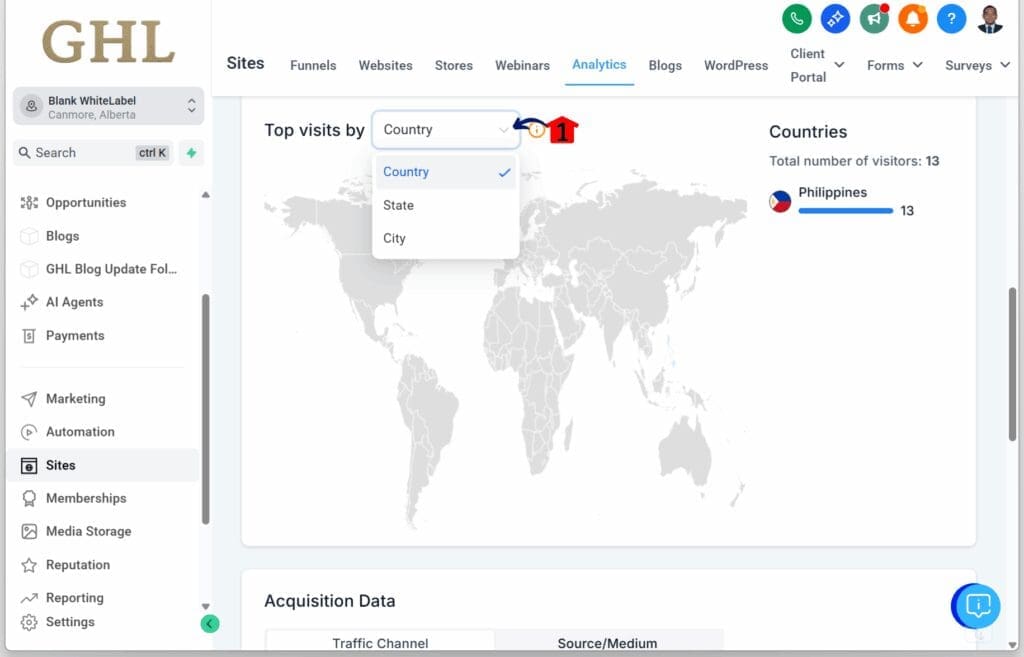
Step 02 – View Top Visits by Country, State, or City
- Scroll down to view the Top Visits By section.
2.1 Click the Top Visits By dropdown button.
- Three options will appear: Country, State, and City. For this example, City is selected.
Step 03 – Review the Ranked List of Visitors
- After selecting one of the three options, a ranked list will appear.
3.1 Hover over any country to see the number of visits your funnels or websites received. (In this example, Funnels was selected.)
3.2 Check the ranked list of visitors displayed on your screen.
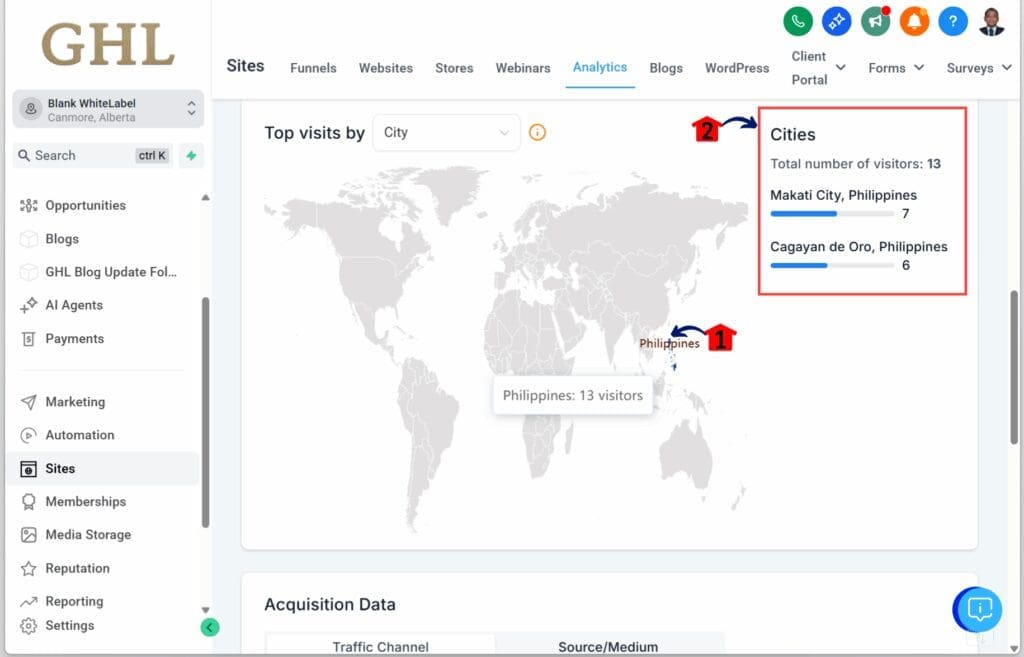
Everything updates as you go. The data is easy to read, and it helps users spot patterns without running long reports.
Pro Tips for GHL Agencies
The new geographic analytics tool in GHL is simple to use, but there is a lot you can do with it once you know what to look for. For agencies that run local or regional campaigns, these tips can help turn visitor data into real results.
Try these practical ideas:
- Build local landing pages. If a city is showing strong traffic, create a version of your funnel or offer that speaks directly to that audience.
- Tag contacts by location. Use workflows to apply state or city tags as leads come in. This makes follow-ups easier to manage and more relevant.
- Adjust your ad budget. Focus your spend on areas that already bring traffic. It is a simple way to get more out of the same budget.
- Support local search. When traffic picks up in a new area, take it as a signal. Update Google Business listings or push for more reviews in that city.
- Use the data in client reports. Show clients where their traffic is growing. It builds trust and helps explain why certain areas are worth more attention.
Geographic analytics in GHL makes it easier to act on what is already working. With small adjustments, agencies can build more focused campaigns and avoid spreading efforts too thin.
What This Means for Your Agency
The new geographic analytics feature in GHL gives agencies a better way to understand where their traffic is coming from. It takes the guesswork out of location-based decisions and replaces it with data that is easy to read and easy to act on.
Agencies no longer have to rely on broad country stats. They can now look at traffic by state or city and adjust their strategy to match what the numbers show.
Here is what this really means:
- Teams can make better marketing choices based on local traffic patterns.
- Reports to clients can include location data that is clear and useful.
- Ads and content can be targeted by region without extra tools.
- Campaigns become more focused, which saves time and budget.
With geographic analytics now part of the GHL dashboard, agencies have more control over how they plan and adjust their marketing. It is a simple upgrade that can lead to better outcomes.
Results You Can Expect
With geographic analytics now built into GHL, users can expect more useful insights from their traffic data. The new view helps agencies and businesses take action based on what is really happening across different regions.
These are the kinds of results that are most likely:
- Better targeting. When you know which states or cities are active, you can put your focus there.
- Smarter ad spending. It is easier to stop wasting money on areas that are not bringing results.
- Clearer reports for clients. You can show where the traffic is coming from and what it means.
- Faster decisions. Spot changes in location trends and adjust your strategy before it is too late.
- Stronger planning. When certain areas show promise, you can use that information to guide growth.
This update does not add more work. It simply gives users a clearer view of where traffic comes from. That kind of detail helps agencies and marketers make better choices without adding extra tools or guesswork.
FAQs about this Geographic Analytics Update
Final Take: Why Every GHL User Should Use This
The new geographic analytics feature in GHL helps users see where their traffic is really coming from. Instead of only looking at country-level data, they can now view activity by state and city. This makes it easier to find patterns, adjust campaigns, and support clients with more accurate reporting.
For agencies, this kind of detail helps answer important questions. Where should we focus next? Which regions are responding best? What can we stop doing?
It is not a complex tool. It is already part of the GHL dashboard and easy to use. A few clicks are all it takes to start exploring traffic by location.
This update is about clarity. It gives users a better way to work with their data and improve results across different markets. Any agency or business that serves more than one area can benefit from using it.
Scale Your Business Today.
Streamline your workflow with GoHighLevel’s powerful tools.
