- See how GHL’s rebuilt course reporting dashboard helps you track learner activity, spot drop-offs, and improve completion rates.
- Quick Summary – Course Progress Analytics at a Glance
- What Changed in Course Progress Analytics?
- Before and After Course Progress Analytics
- Why Course Progress Analytics Matters
- How to Use Course Progress Analytics in GHL
- Quick Tips for Better Course Progress Analytics
- What Course Progress Analytics Means for Your Business
- Frequently Asked Questions About Course Progress Analytics
- Put Course Progress Analytics to Work
See how GHL’s rebuilt course reporting dashboard helps you track learner activity, spot drop-offs, and improve completion rates.
Course Progress Analytics Gets a Full Rebuild
Course Progress Analytics just got a full rebuild in GoHighLevel, and the change makes it much easier to see how learners move through your courses. You can now track completion trends, average progress, time to complete, and learner drop-offs from one clear dashboard.
The new Course Progress Analytics view also gives you filters for course and enrollment date, along with a simple learner journey from Enrolled to Started to Completed. You can also review each member’s progress, activity, completion status, and session details without jumping to different reports.
The biggest win is simple. You get faster load times, less data use, and clearer reporting in one place. That gives course creators and agencies a better way to spot problems early, support learners, and improve the course experience using real data.
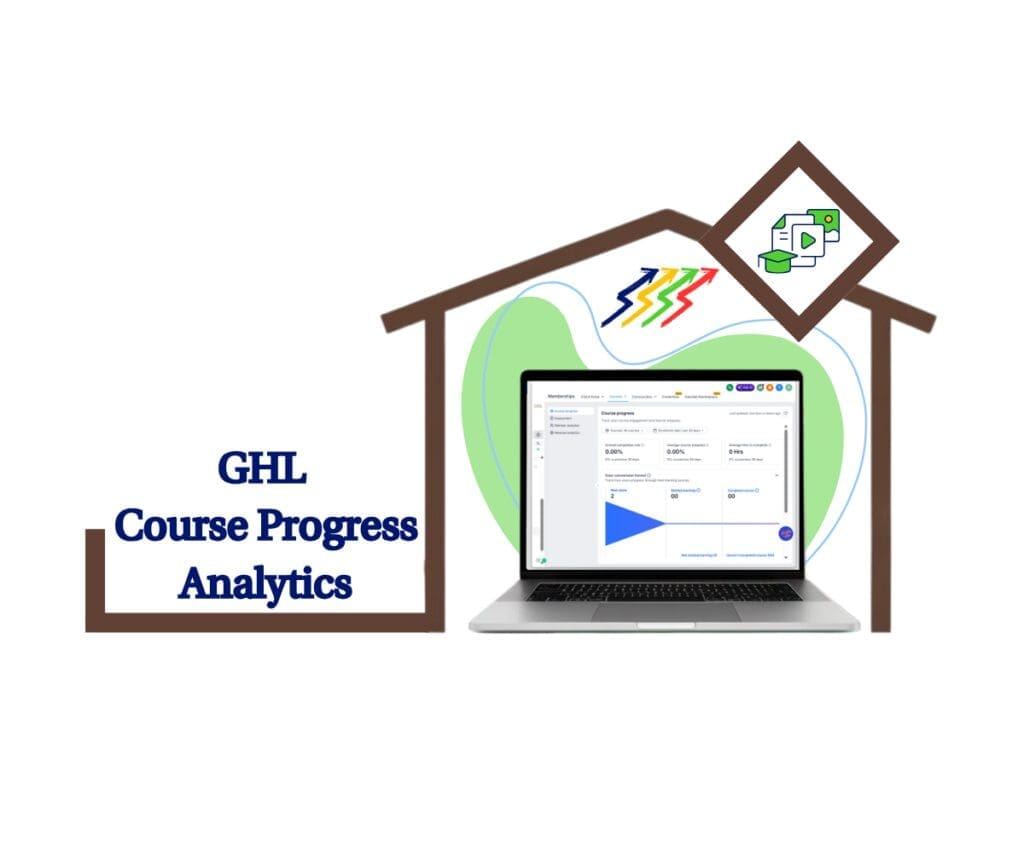
Course Progress Analytics gives you one clear place to track learner engagement, spot where students drop off, and review individual progress. This helps you improve course content, support struggling learners, and make smarter decisions using real data.
Quick Summary – Course Progress Analytics at a Glance
Purpose: Course Progress Analytics helps you track learner progress, course completion, and member activity from one dashboard.
Why It Matters: You can spot drop-off points sooner and make course changes based on real learner data.
What You Get: You get course filters, enrollment date filters, key metrics, a learner funnel, member-level details, and CSV exports.
Time to Complete: You can open the dashboard and review the main data in about five minutes.
Difficulty Level: Beginner-friendly. The dashboard is simple to access and easy to filter.
Key Outcome: You can make faster decisions, support learners sooner, and improve the course experience with less guesswork.
What Changed in Course Progress Analytics?
Course Progress Analytics now puts the main course data in one clear dashboard. You can filter by course and enrollment date, so it is easier to focus on the learners and time periods that matter most.
The dashboard also shows Completion Rate, Average Progress, and Time to Complete. Each number includes a period comparison, which helps you see if results are improving or falling behind. The learner journey funnel also shows how many people moved from Enrolled to Started to Completed.
Automate marketing, manage leads, and grow faster with GoHighLevel.
The Member Progress Table gives you a closer look at each learner’s activity, progress, completion, and session details. GoHighLevel also made the page faster, with about 43% quicker load times and about 90% less data downloaded. The result is a smoother report that is easier to use.
Before and After Course Progress Analytics
Before the rebuild, course data was harder to review in one place. You could still check learner progress, but it took more effort to compare results, find drop-off points, and review individual activity.
Now, Course Progress Analytics brings the key details into one dashboard. You can compare time periods, follow the learner journey, and open the Member Progress Table when you need a closer look at one person.
The difference is simple. You spend less time digging through reports and more time using the data. That makes it easier to spot weak lessons, support learners who are falling behind, and improve the course based on real activity.
Why Course Progress Analytics Matters
Course Progress Analytics helps you see what learners are doing, not just what you hope they are doing. You can quickly spot who has started, who has stopped, and who has finished the course.
That matters because low progress often points to a real problem. A lesson may be too long, the content may be unclear, or learners may need a simple reminder. The data gives you a better place to start.
For agencies, coaches, and course creators, this means fewer guesses and better decisions. You can improve weak parts of a course, support learners sooner, and share clear results with your team or clients.
How to Use Course Progress Analytics in GHL
Course Progress Analytics gives you one place to review course completion, learner activity, and progress. In this guide, you’ll learn how to open the dashboard, choose a course, set the enrollment date, review the main metrics, and check individual member progress.
Here are the steps we will follow:
- Access the Course Analytics area in GoHighLevel.
- Open the Course Progress dashboard.
- Choose a Course to Review.
- Set the Enrollment Date and Review Members.
To start, make sure you are logged in to the correct GoHighLevel sub-account.
Step 01 – Access the Course Analytics Area in GoHighLevel
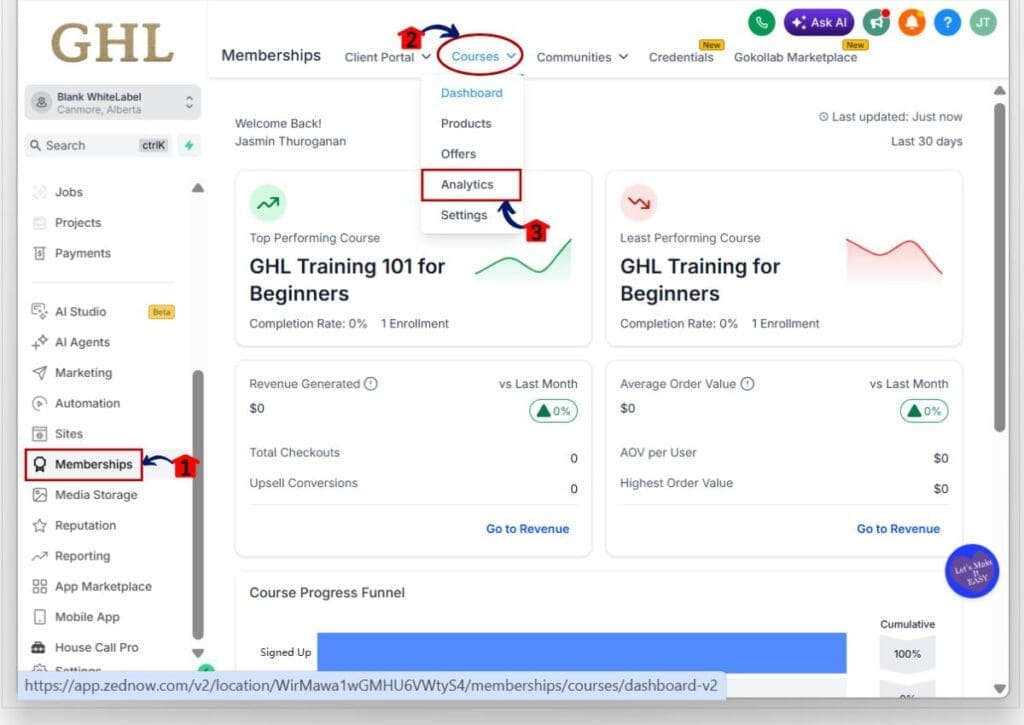
- The Memberships section includes the tools used to manage your courses, offers, learners, and course reports.
1.1 Click Memberships in the left menu.
- This opens the main Memberships area.
1.2 Click Courses in the top navigation.
- A dropdown menu with the available course options will open.
1.3 Click Analytics.
- This opens the Courses Analytics area.
Step 02 – Open the Course Progress Dashboard
- The Analytics area includes several reports for course activity, members, assessments, and revenue.
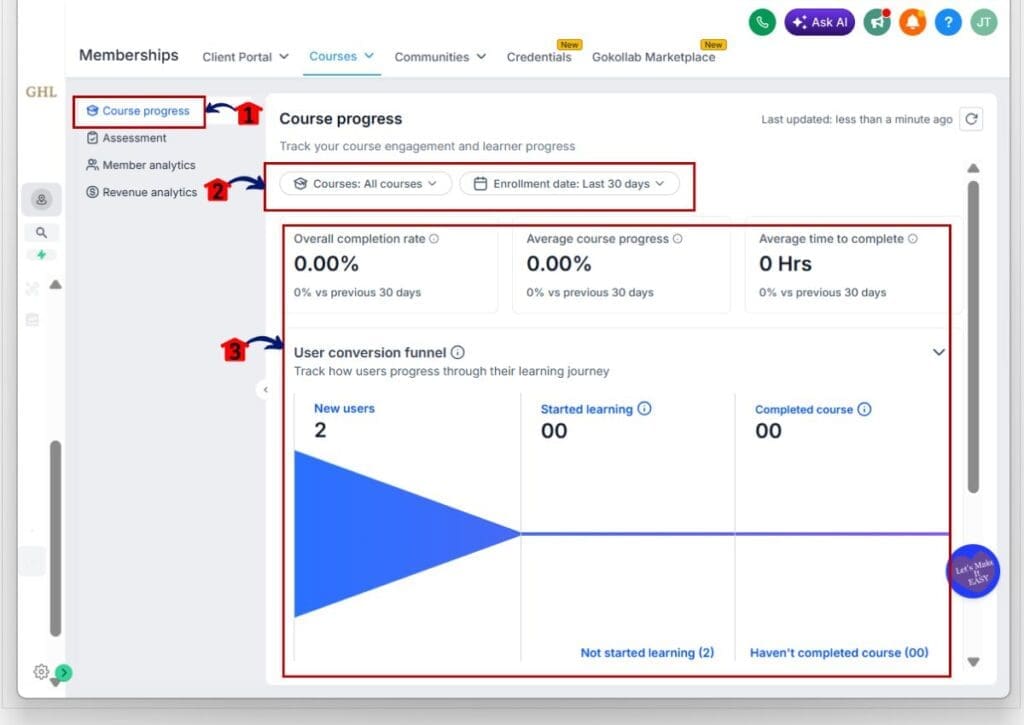
2.1 Click Course progress in the left menu.
- This opens the rebuilt Course Progress Analytics dashboard.
2.2 Review the course and enrollment date filters at the top of the dashboard.
- These filters control which learners and courses appear in the report.
2.3 Review the main course metrics.
- The dashboard shows:
- Overall completion rate
- Average course progress
- Average time to complete
- Each metric also includes a comparison with the previous period.
2.4 Review the User Conversion Funnel.
- The funnel shows how learners move from New Users to Started Learning and Completed Course.
- Use this section to spot where learners stop moving through the course.’
Step 03 – Choose a Course to Review
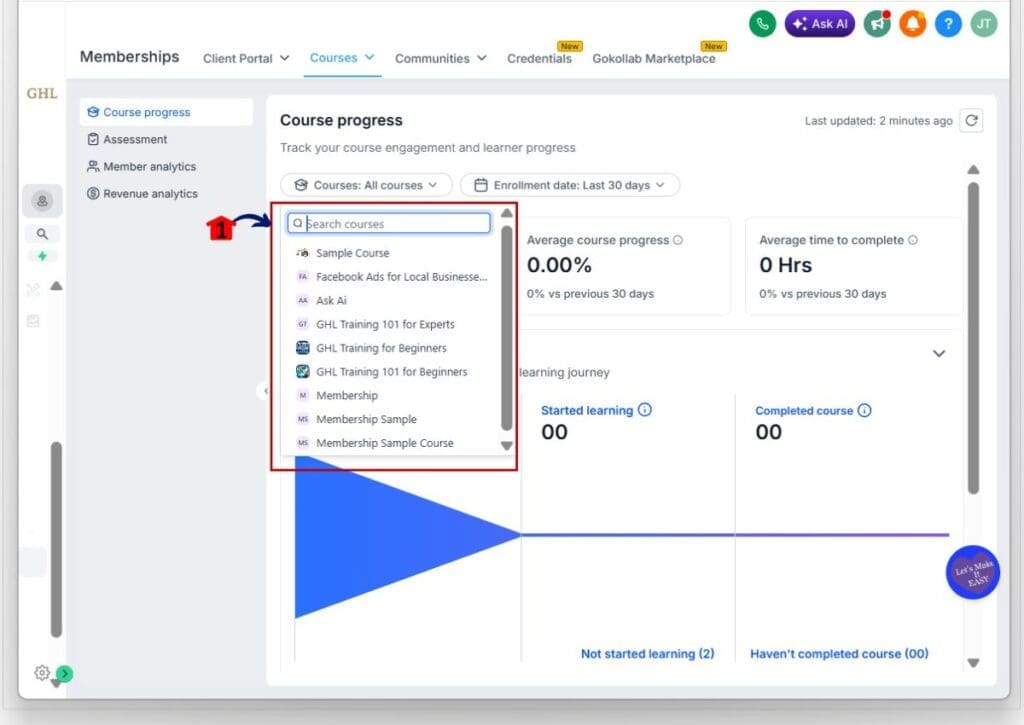
- The Course filter lets you review all courses together or focus on one course.
3.1 Click the Courses filter at the top of the dashboard.
- A list of your available courses will open.
3.2 Use the search field when needed.
- Enter the course name to find it faster.
3.3 Click the course you want to review.
- The dashboard will update to show progress data for the selected course.
3.4 Leave All courses selected when you want a wider view.
- This option is useful when you want to compare overall learner activity across your full course library.
Step 04 – Set the Enrollment Date and Review Members
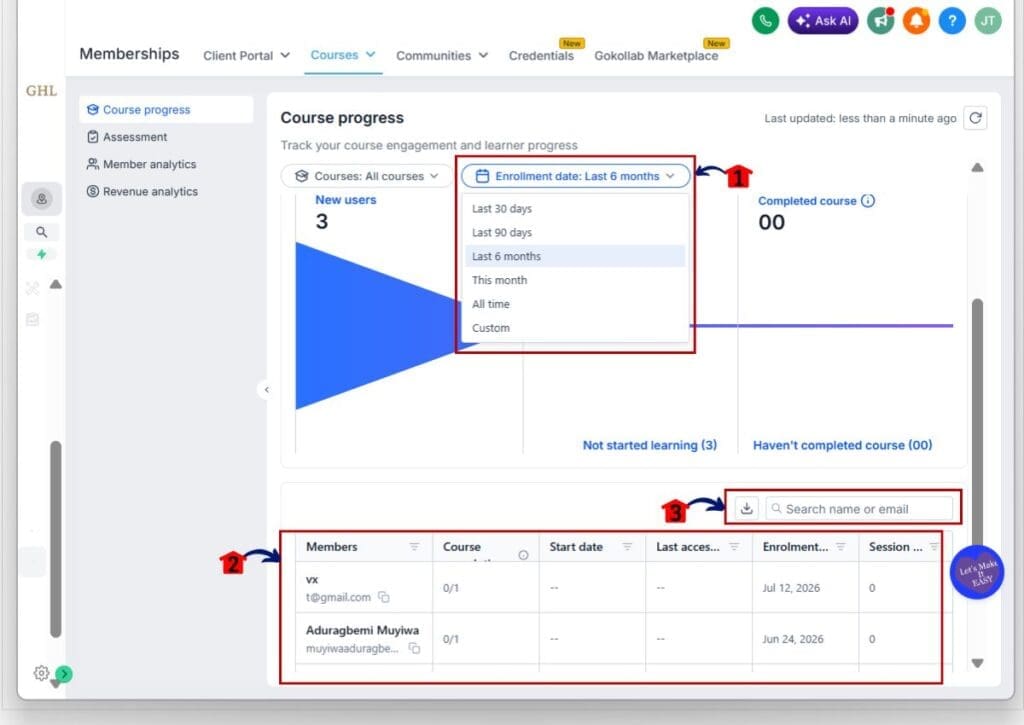
- The Enrollment Date filter helps you focus on learners who enrolled during a set period.
4.1 Click the Enrollment date filter.
- A list of available date ranges will open.
4.2 Choose the date range you want to review.
- The available options include:
- Last 30 days
- Last 90 days
- Last 6 months
- This month
- All time
- Custom
4.3 Choose Custom when you need a specific date range.
- Use this option when reporting on a launch, campaign, intake period, or client reporting cycle.
4.4 Review the Members table below the funnel.
- The table shows details such as:
- Member name and email
- Course progress
- Start date
- Last access date
- Enrollment date
- Session count
4.5 Use the search field to find a specific member.
- Enter the learner’s name or email address.
4.6 Click the export icon to download the filtered report.
- The export will use the course and enrollment date filters currently selected.
Once the filters are set, review the funnel and Members table together. The funnel shows the bigger picture, while the table helps you find the learners who may need support.
Quick Tips for Better Course Progress Analytics
Course Progress Analytics works best when you use the filters with a clear goal. Review one course and one date range at a time. This makes it easier to see what changed and where learners may be getting stuck.
Do not judge the course by one number alone. A low completion rate may look bad, but the Members table can show whether learners are still active. Check the funnel, average progress, and last access date before you make changes.
Start with one clear problem. If many learners enroll but never start, improve your welcome message or first lesson. If they start but do not finish, review the lessons near the drop-off point. Small changes are easier to test and measure.
What Course Progress Analytics Means for Your Business
Course Progress Analytics gives you a clearer way to manage courses with real learner data. Instead of guessing why people stop, you can check the funnel, review member activity, and find the point where progress slows down.
For course creators, this can lead to better lessons and stronger follow-up. For agencies, it can also improve client reporting. You can show clear progress data, explain where learners need support, and back up your advice with numbers.
The main benefit is better decisions with less digging. You can spot problems sooner, make one focused change, and then check the results over time.
Frequently Asked Questions About Course Progress Analytics
Put Course Progress Analytics to Work
Course Progress Analytics gives you a faster and clearer way to see how learners move through your courses. You can review completion, progress, time to complete, drop-off points, and member activity from one dashboard.
The best place to start is with one course and one date range. Check the funnel, review the Members table, and look for one clear issue you can fix. That may be a weak first lesson, poor follow-up, or a section where learners often stop.
Once you make a change, return to Course Progress Analytics and compare the results. Better course data leads to better decisions, stronger learner support, and a smoother course experience.
Scale Your Business Today.
Streamline your workflow with GoHighLevel’s powerful tools.