New GHL features help you track trigger stats, add workflow narration, and monitor automation metrics from a single dashboard.
Ever wonder which automations are pulling their weight… and which ones are just sitting there? Now you don’t have to guess.As part of GHL’s Level Up Days, three powerful updates just landed — all focused on giving you clearer, smarter visibility into how your automations are performing. With new trigger stats, narration tools, and a full workflow overview dashboard, you can finally see what’s working, what needs fixing, and where your growth opportunities live.
If you’re managing a dozen workflows across multiple campaigns or clients, these upgrades are going to feel like a superpower. These new tools make it easy to measure, monitor, and optimize every part of your automation — from trigger stats to overall workflow activity, all in one place.
These new tools make it easy to measure, monitor, and optimize every part of your automation — from trigger stats to overall workflow activity, all in one place.
Quick Summary – Workflow Performance Metrics at a Glance
Purpose:
Help GHL users track, understand, and monitor the performance of their automations with built-in workflow analytics.
Why It Matters:
Without clear workflow metrics, it’s hard to know what’s working. These tools add visibility, improve collaboration, and simplify reporting.
What You Get:
Trigger stats for usage tracking, narration for internal documentation, and a visual dashboard to review automation health across your account.
Time To Complete:
You can access and use all three features in under 5 minutes.
Difficulty Level:
Beginner-friendly — no setup required.
Key Outcome:
Smarter automation decisions, better workflow management, and full visibility into performance metrics.
What’s New + How to Use These Updates
This Week’s Updates: Workflow Visibility Just Got a Big Boost
This Level Up batch is all about clarity. Whether you want to monitor what’s triggering your workflows, annotate your automations, or get a full bird’s-eye view — these features deliver.
Automate marketing, manage leads, and grow faster with GoHighLevel.
1. Trigger Stats in Workflows
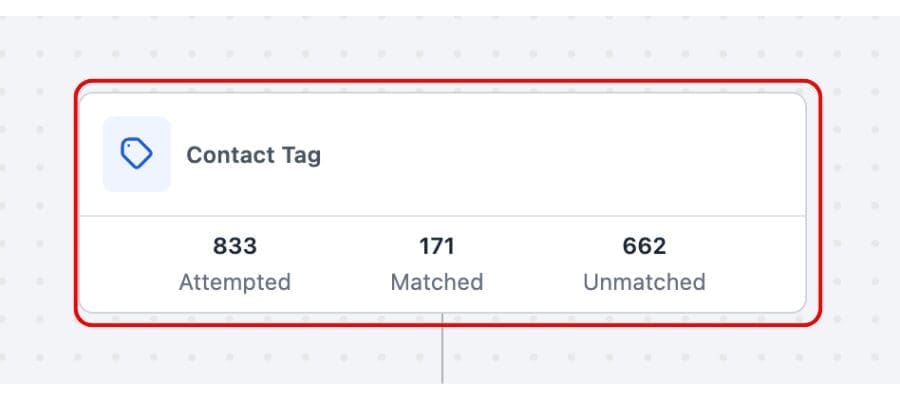
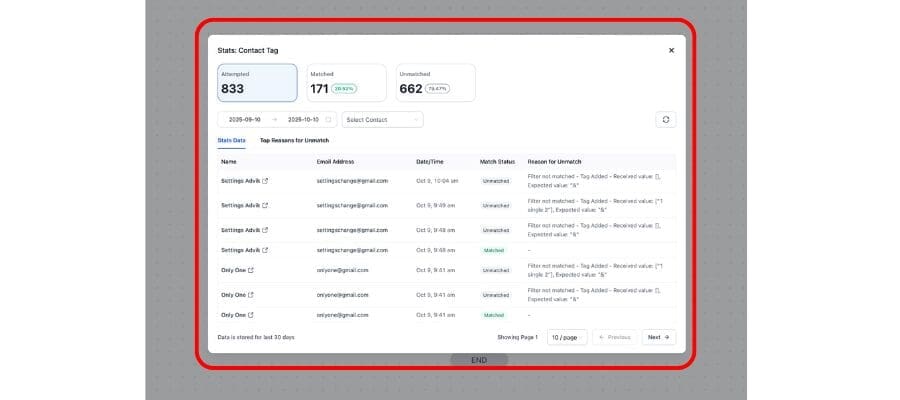
GHL now shows how many times each trigger has fired — right inside your workflow.
You’ll find the stat next to each trigger block in the builder. It gives you a real-time count of how often that trigger has activated, helping you measure performance or spot logic issues.
Use it to:
- Compare which opt-ins or forms are driving the most automation
- Diagnose workflows that aren’t running as expected
- Understand traffic trends in real time
2. Trigger Narration in Workflows
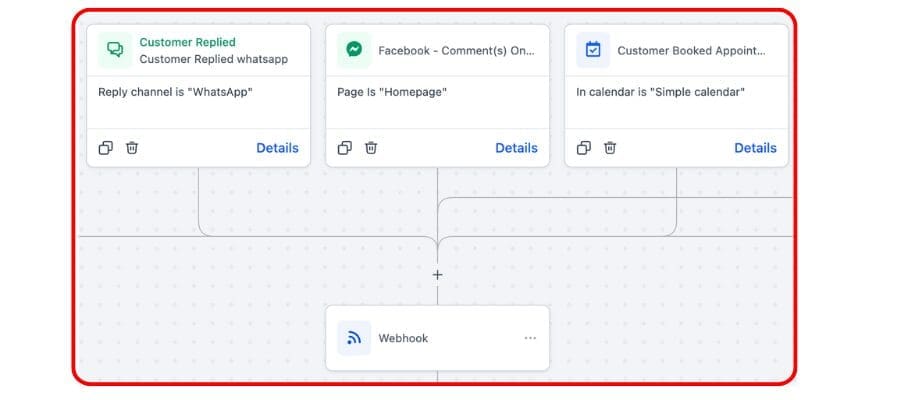
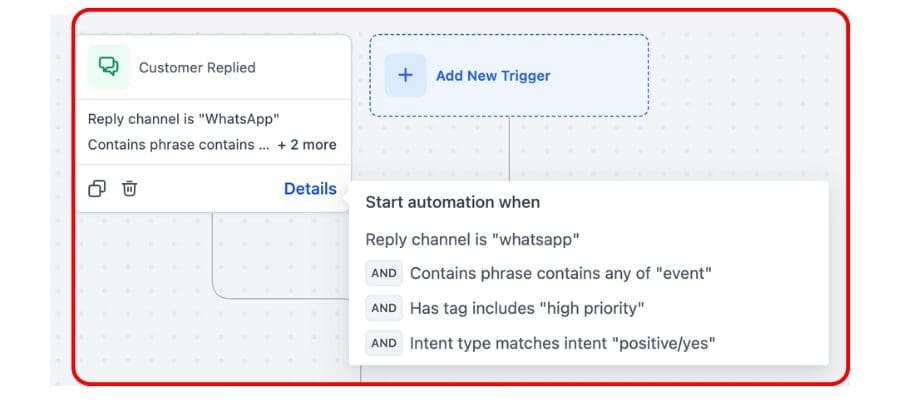
Now you can add internal descriptions or notes to each trigger. It’s like sticky notes — but built right into the logic.
Use this to explain what each trigger does, add team instructions, or warn against removing critical triggers. If you’re cloning templates or sharing builds, this makes everything clearer.
Find it under each trigger — just click and type.
3. Workflow Overview Dashboard
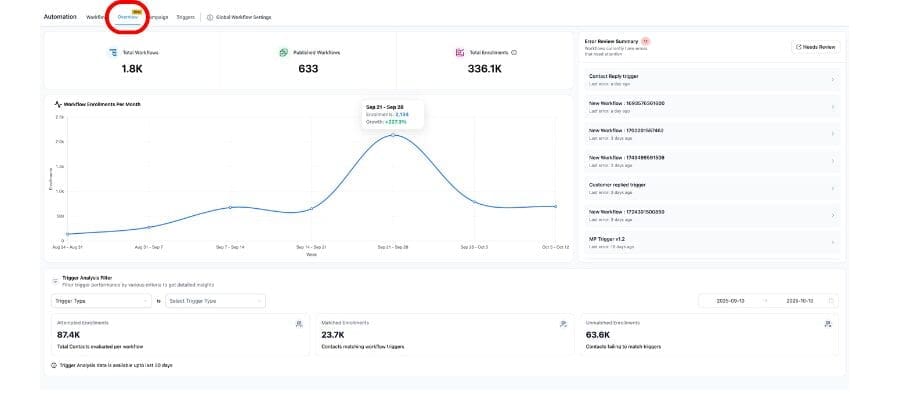
This one’s big: a new dashboard that shows every active workflow in your account, with data like:
- Total number of triggers
- Last updated time
- Conversion stats (coming soon)
- General status visibility
Access it under Automations > Overview — and use it for quick health checks or weekly reviews.
Pro Tips & Real-World Use Cases
These new workflow visibility tools aren’t just for power users — they’re built for anyone managing multiple automations across clients or campaigns.
Here’s how to start using them like a pro:
Spot dead triggers fast.
Not all workflows get triggered equally. With the new stats, you can see which triggers are doing the heavy lifting — and which ones might need to be replaced or retired.
Document complex logic for your team.
Workflow getting messy? Add narration to your triggers to label each one. Example: “This kicks off only when the VIP tag is added” or “Part of post-sale onboarding flow.” It makes onboarding new team members way easier.
Run weekly performance checks.
Open the Workflow Overview Dashboard every Friday. Scan for flows that haven’t been triggered in weeks. It’s an easy way to spot forgotten or broken automations before they cause problems.
Bonus: If you’re an agency, these visibility features make client reporting easier too. You can show exactly what’s firing, what’s paused, and what’s active — without opening every single flow.
FAQ
Wrap-Up – Measure More, Guess Less
With trigger stats, narration, and a workflow dashboard, you now have real insight into what your automations are doing — and how well they’re doing it.
Start using these tools today. The data’s already there — now you just have to use it to work smarter.
Scale Your Business Today.
Streamline your workflow with GoHighLevel’s powerful tools.


